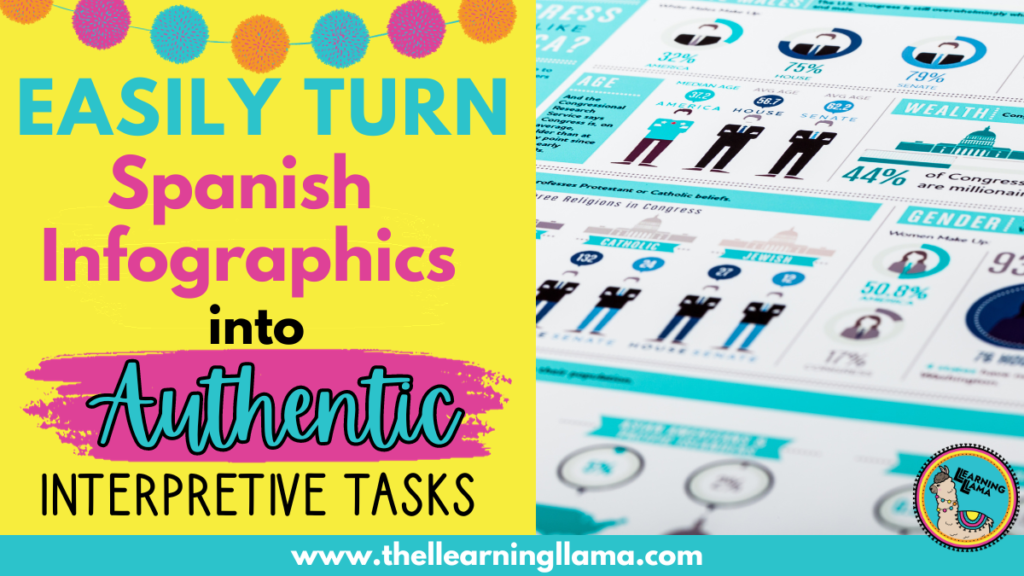
Do you struggle to find authentic resources in the target language? Finding resources, especially for novice level students can be challenging. One of my favorite resources to use for all levels is infographics. Infographics provide visuals, brief text, authentic information, and relevant topics.
So once you find an infographic that fits your lesson and content, what do you do with it? Just asking comprehension questions can make for a boring, expected interpretive task. I’m going to share with you a bunch of activities and questions you can ask your students to turn infographics into interactive and practical authentic resources for the world language classroom.
The activities below will extend the life of an infographic activity. You can check for understanding, add presentational elements, learn vocabulary and even create manipulatives all out of just ONE infographic!
What is an infographic?
An infographic is a visual representation of text or information. It is one of the most accessible authentic resources for world language students. The combination of visuals with brief text gives our students the confidence they need to interpret an authentic text. In addition to it being super comprehensible for world language students, using infographics helps build media literacy and higher-order thinking skills. You can read more from Edutopia here.
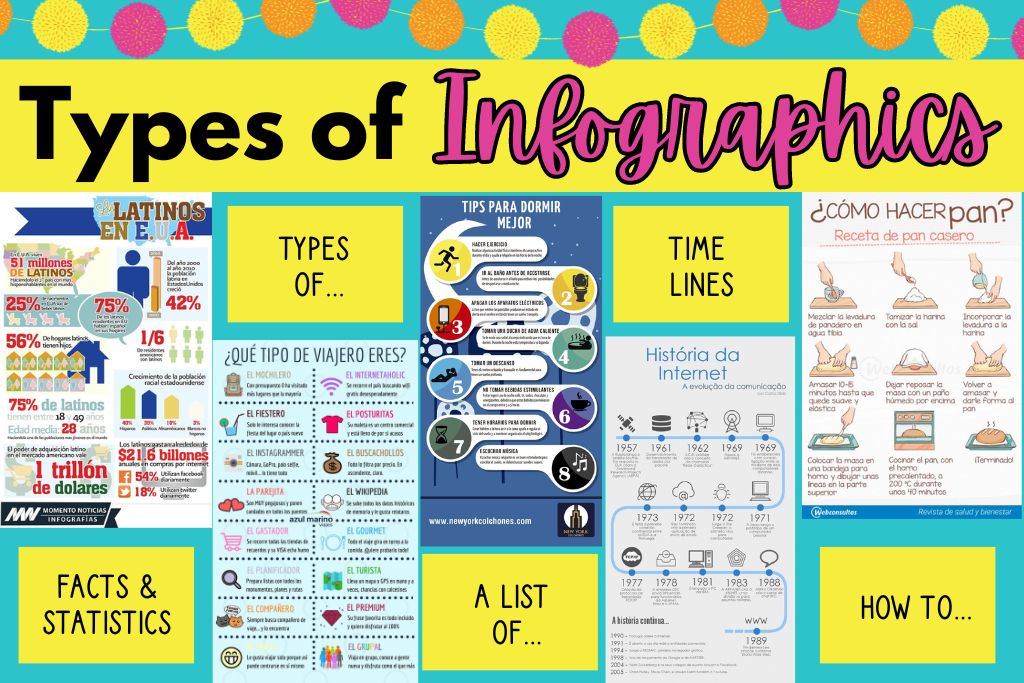
Types of Infographics
There are many styles of infographics that can fit your curriculum needs. Here are some types of infographics:
- Timelines
- A List of # of Tips, Rules, Ideas, Habits etc.
- How to…
- Types of (personality, animals, foods, etc.)
- Benefits of…
- Basic Info (overview of a topic)
- Facts and Data (lots of statistics, percentages, numbers)
Where can I find infographics for the classroom?
There are three main ways that I find infographics. The first is my favorite – Pinterest! You can search for any content or curriculum area with the word “infographic” or “infografia” after it and you’ll yield tons of results. For example, with a simple search of “la comida infografia” look at these results. And if you were to keep scrolling, it seems as though the results are endless. Here is my Pinterest account. I have my boards saved by theme and pin mostly infographics and authentic resources.
You can also do the same search on Google Images, and I actually find different results on both search engines. The best part of Pinterest is that you can save the infographics as you go, because you may stumble across some that you can’t use now but will want to come back to in the future.
Finally, sometimes you need to create your own resources with information from your class. Maybe you are covering a specific topic, or you want to design an infographic to summarize a grammatical concept. Here is how I use Canva to create (and even have my students create!) infographics.
How to use Infographics (7 types of questions you can ask)
Any example questions that I share below will be based off of the ¿Qué tipo de viajero eres? Infographic. I used this with my Spanish 2 students this year and they really enjoyed identifying which traveler they are.
Remember with interpretive tasks, you will want to ask your questions and have students respond in English. This allows for a true check for understanding and not just a glance for the keyword in the target language and writing down what they “think” the correct answer should be, without really understanding what it means.
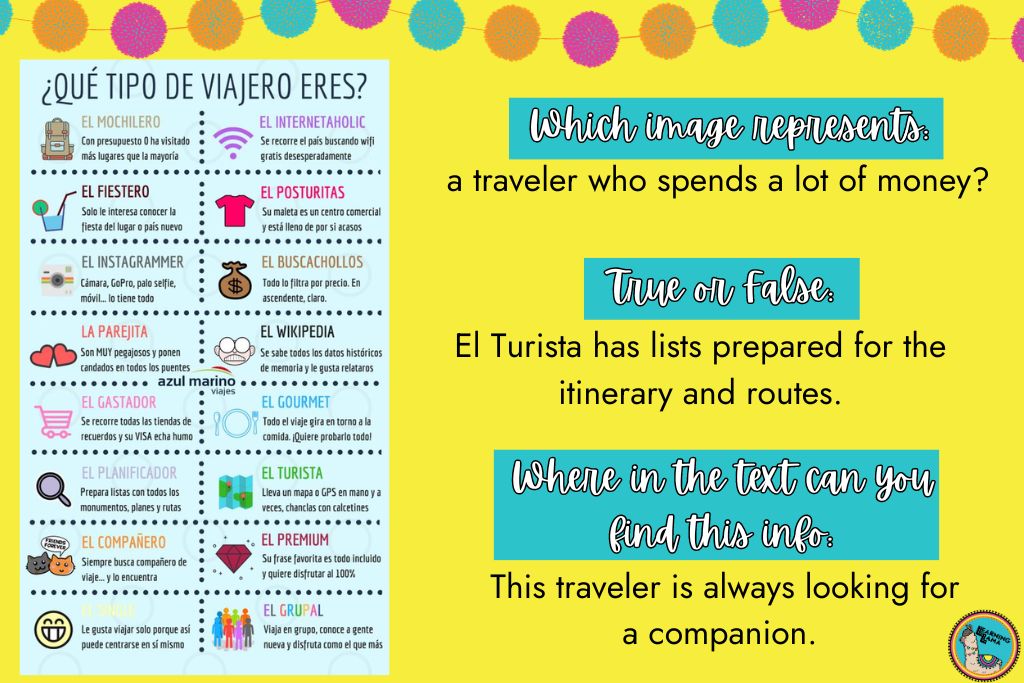
- Which image represents…: Ask students to identify the image that represents a specific idea. The infographic will be in the target language. You want to ask the questions in English. For example, “Which image represents a traveler who spends a lot of money?” You can have the images numbered for easy identification.
- True or false: A classic question style for assessing comprehension
- Where is the text found?: Ask students to identify where a specific fact is on the infographic. Again, the infographic is in the TL, but you will ask in English. For example: “This traveler is always looking for a companion.” Students can tell you which traveler, but you may also have them underline or identify the Spanish words that translate.
- Words in context: Underline new vocabulary words on the infographic. Students will use context clues and images to identify meaning.
- Practice with numbers: This is a great interpretive listening activity. Find an infographic that is very number heavy. Ask students to point to where a specific number is. You can also make this an interpretive reading task by putting the numbers in word form.
- Annotate: Students can make annotation marks to identify what is interesting, what shocks you, what do you want to learn more about? Here is a guide to using annotation marks for any reading and here is a freebie bookmark/poster with annotation symbols.
5 Activities to Do with Images
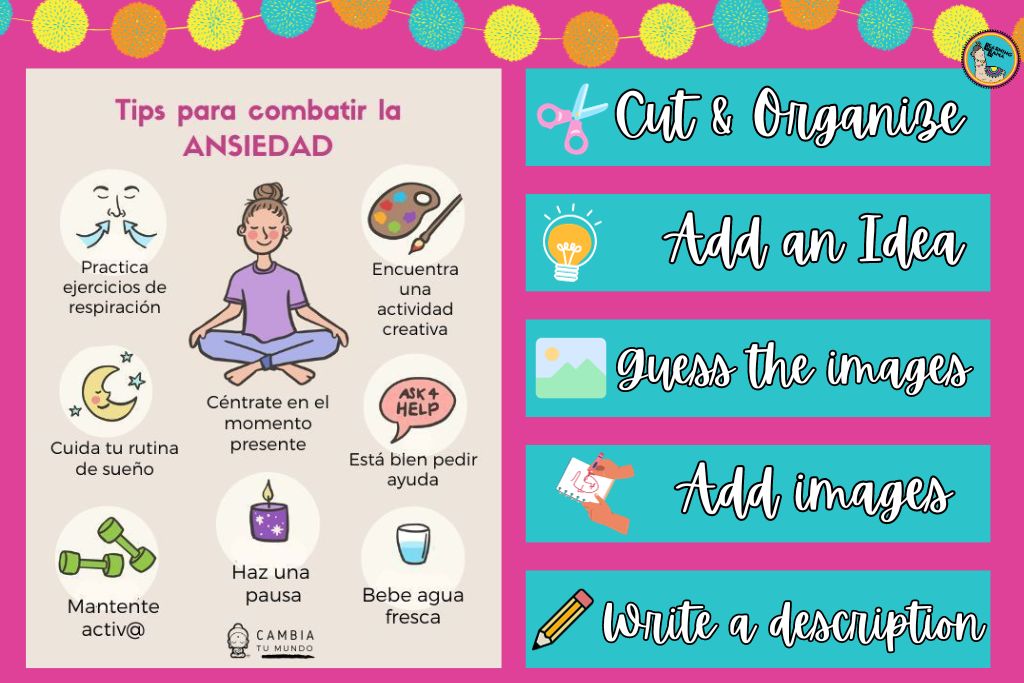
- Cut and organize. This is a hands-on activity. Print out the infographic. Then cut out the images and text separately. Have students match the image to the text and essentially put the infographic back together into one puzzle.
- (Show example of a good infographic for this activity)
- Add an idea! Just because an infographic includes a certain number of facts or tips, doesn’t mean that is ALL that it could include. Here is an example of 8 tips to combat anxiety. Each student or group can draw a symbol and write a 9th tip to combat anxiety.
- Guess the images. Before you print and copy the infographic, cover up the images. Then, when you pass out the infographic to students, they will see text, but white spaces where the images would have been. Have students draw images that would represent each section. Then, reveal the real images and see how close students are!
- Add images. Some infographics actually lack the “graphics.” They are organized nicely with a pretty layout, but only include text. Students can add images. This works really well if you project the infographic on a large screen and give students post-it notes. They can each draw their own images then put them next to the section. You will be able to see how similar/different students interpreted each section.
- Write a description. Sometimes, when infographics are very limited in text, they will just have a brief description of the image. It may be one word or one short phrase. Your students could be tasked with elaborating on the description. Maybe they need to find a statistic that supports the fact, or they could just write a description elaborating, or even an example. Let’s take the “Tips para combatir ansiedad” infographic. Under “Bebe agua fresca,” students may write: “Yo bebo 2 botellas de agua durante el día escolar.” Others may write, “Es recomendable beber 8 vasos de agua cada día.”
I hope these infographic activities inspire you to use more infographics in your lessons. They are the perfect authentic resource and can easily be found for any topic. Share your favorite infographics below or other ways you use them!